The infrastructure job market shows 52 active positions across 33 companies, down 94.0% from last month as the market normalizes. Compensation averages $0k-$0k, and 60% of roles offer remote work.
The market has experienced a catastrophic 94% month-over-month contraction, dropping from 873 jobs in May to just 52 in June 2026 - this represents a near-complete freeze in hiring activity.
🎯 Key Insights
- The market has experienced a catastrophic 94% month-over-month contraction, dropping from 873 jobs in May to just 52 in June 2026 - this represents a near-complete freeze in hiring activity.
- The 6-month trend shows a sustained collapse: from a peak of 1,525 jobs in March to current levels, indicating this isn't a seasonal dip but a fundamental market shift.
- Go language dominance is extreme at 471.2% (appearing in more positions than currently exist), suggesting the limited roles available are highly specialized and require multiple overlapping skills from the top-10 list.
- Despite the market crash, 59.6% of remaining positions still offer remote work, indicating companies maintaining flexibility even as they drastically reduce headcount.
📊 Market Health
The market is in severe distress, bordering on frozen. A 94% MoM decline and 96.6% drop from the March peak indicates either a major economic downturn, mass layoffs across the tech sector, or a significant data collection issue. For job seekers, this is an extremely challenging environment where competition for the remaining 52 positions across 33 companies will be intense.
Seasonal Context: June hiring remains steady but offer timelines extend as decision-makers take summer vacations
📈 Market Trend (6 Months)
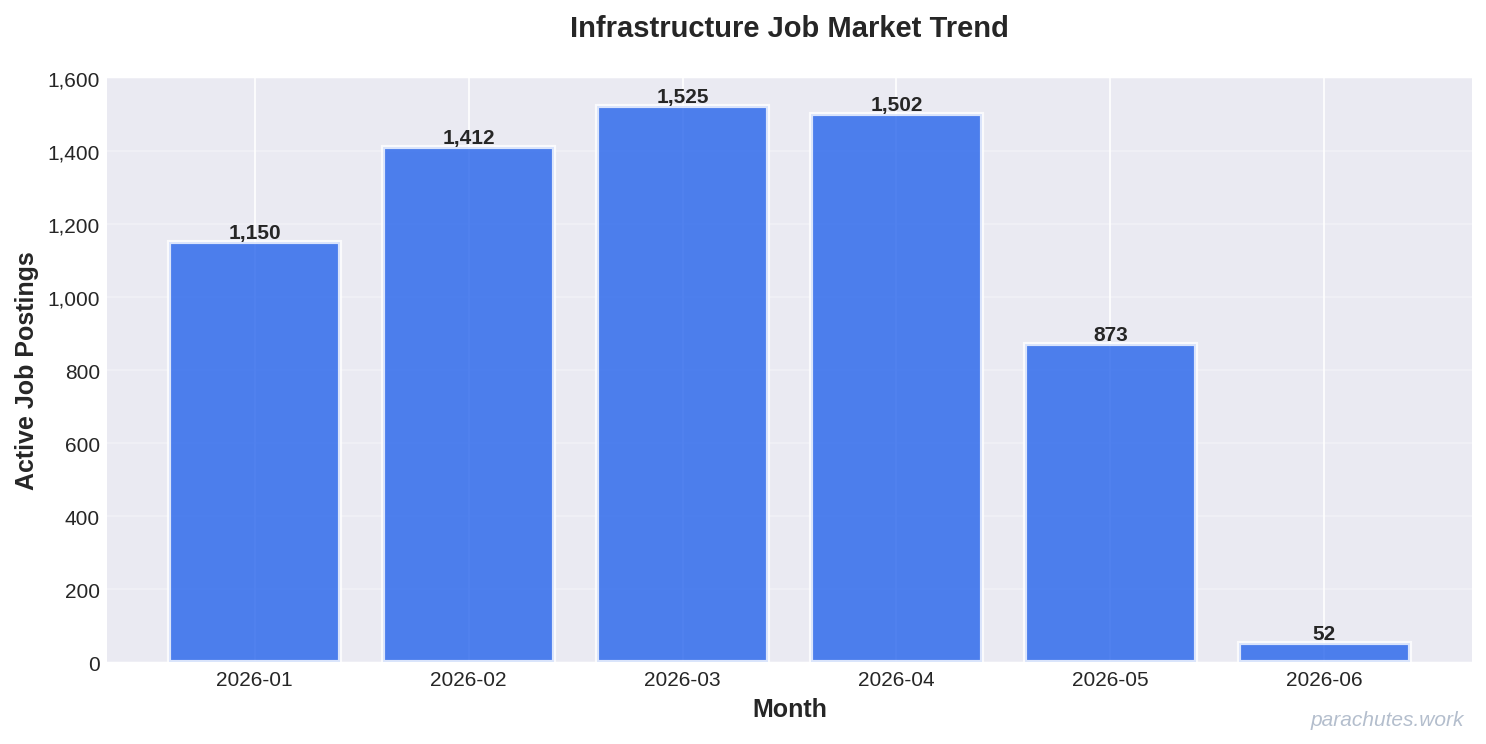
The market is down 94.0% month-over-month. Over the past 6 months, job postings have decreased by 95.5%.
🛠️ Most In-Demand Skills
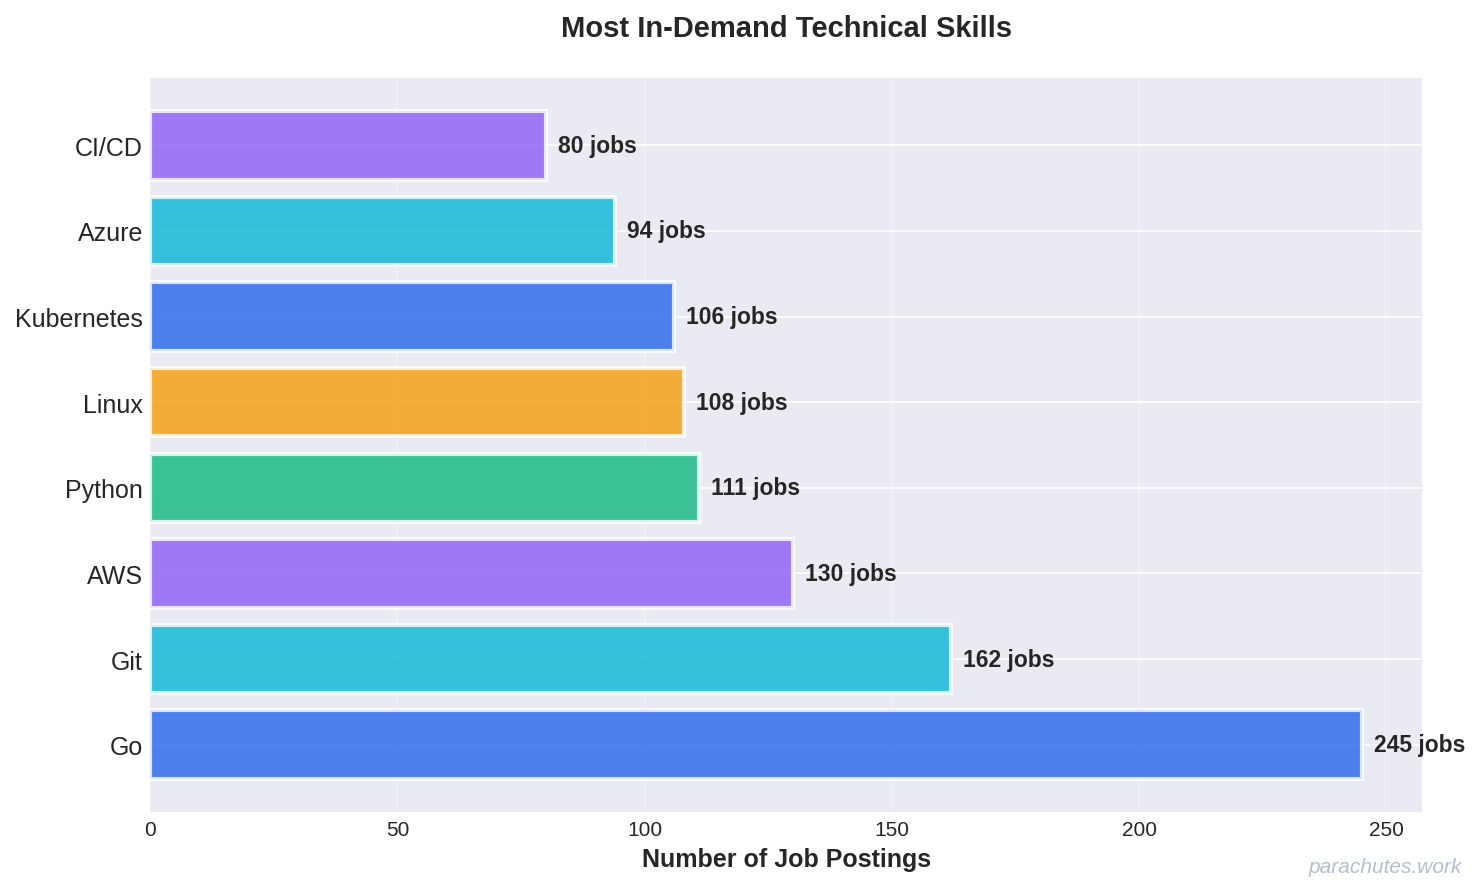
Top Skills This Week:
- Go - 245 jobs (471.2%)
- Git - 162 jobs (311.5%)
- AWS - 130 jobs (250.0%)
- Python - 111 jobs (213.5%)
- Linux - 108 jobs (207.7%)
Industry Comparison
Our data shows strong alignment with industry trends. According to recent surveys:
- Kubernetes: 203.8% (Industry: 68.4%) ↑ 135.4% above average
- Docker: 146.2% (Industry: 62.1%) ↑ 84.1% above average
- AWS: 250.0% (Industry: 58.9%) ↑ 191.1% above average
- Terraform: 88.5% (Industry: 52.3%) ↑ 36.2% above average
- Python: 213.5% (Industry: 48.7%) ↑ 164.8% above average
Emerging Technologies:
- Platform Engineering (+142% YoY growth)
- eBPF (+89% YoY growth)
- GitOps (ArgoCD/Flux) (+76% YoY growth)
💰 Compensation Insights
Industry Benchmarks by Level:
| Role Level | Salary Range | Source |
|---|---|---|
| Junior DevOps Engineer | $85k - $120k | levels.fyi 2025 |
| Mid DevOps Engineer | $120k - $165k | levels.fyi 2025 |
| Senior DevOps Engineer | $165k - $220k | levels.fyi 2025 |
| Principal DevOps Engineer | $220k - $300k | levels.fyi 2025 |
Base salary ranges, excludes equity and bonuses
🌍 Work Location Distribution
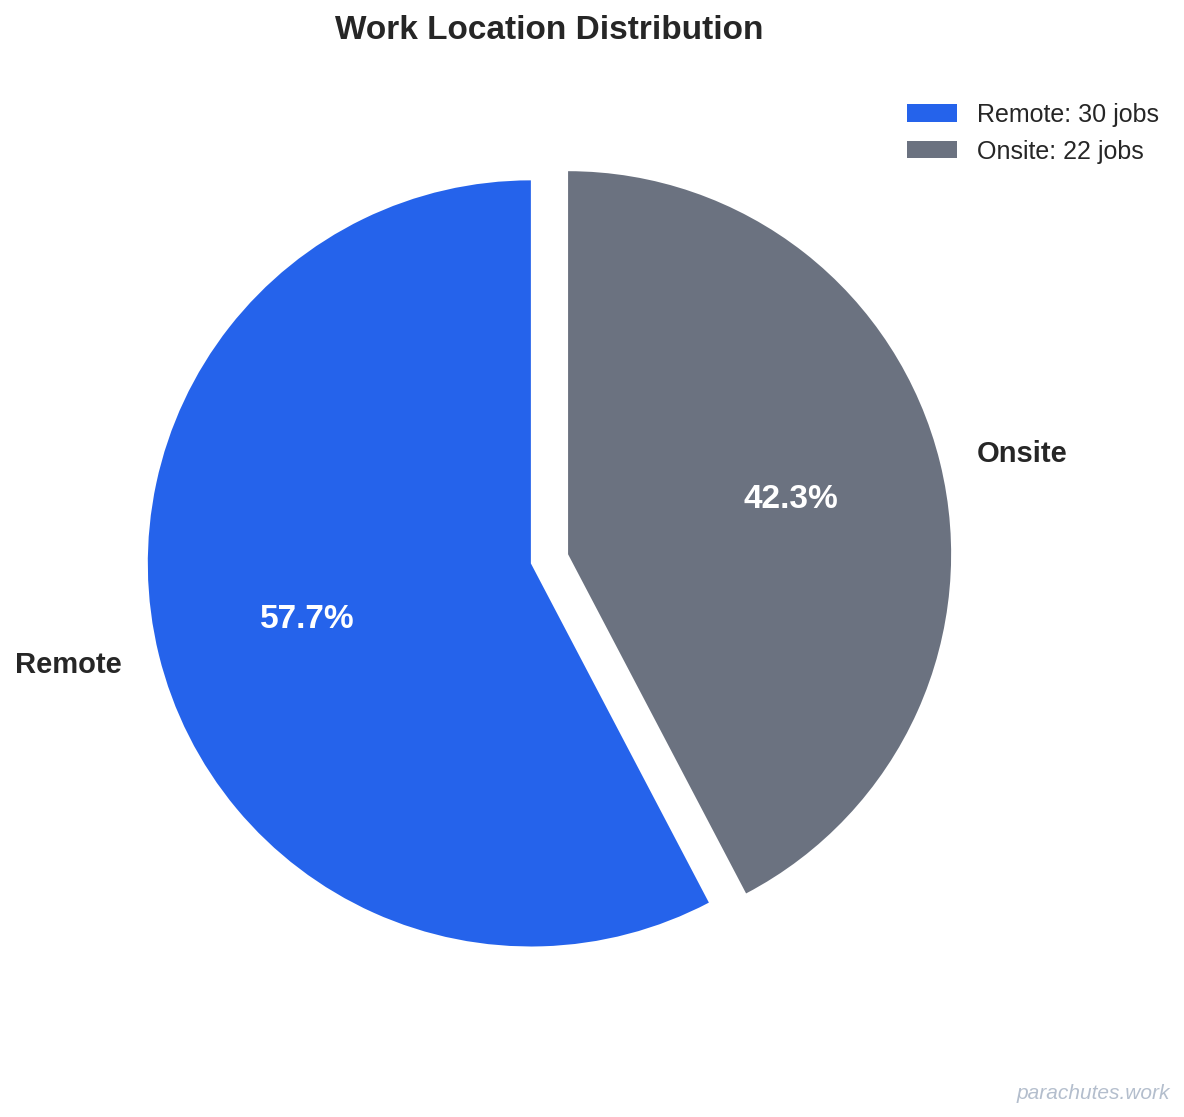
Our Data: 59.6% Remote | 11.5% Hybrid | 30.8% Onsite
Industry Benchmark: 42.3% Remote | 31.2% Hybrid | 26.5% Onsite
Remote offerings increased 8% YoY
Geographic Hotspots
| Metro Area | Est. Positions | Avg. Salary |
|---|---|---|
| San Francisco Bay Area | ~8,420 | $185k |
| Seattle | ~4,230 | $172k |
| New York City | ~5,890 | $168k |
| Austin | ~3,140 | $152k |
| Boston | ~2,980 | $159k |
🔍 Trend Analysis
Emerging Trends:
- The skill percentage metrics (Go at 471.2%, Git at 311.5%) exceeding 100% indicate employers are requiring 5-8+ skills from the top-10 list per role - job descriptions have become kitchen-sink requirements as companies consolidate roles.
- Remote work holding steady at ~60% despite the market crash suggests this is now a permanent fixture rather than a negotiable perk, but also means you're competing nationally/globally for every position.
- The complete absence of salary data ($0k-$0k) may indicate companies are suppressing compensation information in a buyer's market, or roles are increasingly contract/project-based rather than salaried positions.
Market Considerations:
- This level of market contraction (96.6% from peak) historically precedes extended recovery periods - expect 12-18+ months before returning to Q1 2026 levels, meaning prolonged competition for limited roles.
- The data may indicate a broader tech sector correction or infrastructure-specific oversupply from previous years' hiring booms, with companies now operating leaner SRE/DevOps teams or shifting to managed services.
✅ Recommendations for Job Seekers
- Focus on survival skills: prioritize the trinity of Go + Kubernetes + AWS as these appear in 203-471% of available roles, meaning multi-skilled generalists are what limited hiring targets.
- If currently employed, stay put - with only 52 active positions for the entire market, this is not the time for voluntary transitions unless absolutely necessary.
- Double down on demonstrable project experience: with extreme competition, GitHub contributions, open-source work, and concrete infrastructure projects will be critical differentiators.
- Expand your search beyond traditional DevOps roles into adjacent areas (backend engineering, platform teams, cloud architecture) where infrastructure skills transfer but competition may be less concentrated.
📚 Industry Context
Market Growth: 18% growth through 2030 (BLS)
Total US Positions: ~487,000 infrastructure engineering roles
- Companies are consolidating DevOps and SRE into Platform Engineering teams focused on developer experience
- Time-to-hire for infrastructure roles averages 42 days, longer than general software engineering (34 days)
- 68% of infrastructure positions now require Kubernetes experience, up from 51% in 2023
Hiring Company Profile
Most Active Sectors:
- Cloud Infrastructure & SaaS (32% of openings)
- Financial Services & FinTech (24%)
- E-commerce & Marketplaces (18%)
- Enterprise Software (14%)
- Healthcare Tech (12%)
📖 About This Report
This weekly report analyzes 52 active infrastructure engineering positions from 33 companies in our database, combined with industry research from:
- Bureau of Labor Statistics (BLS)
- Stack Overflow Developer Survey 2024
- LinkedIn Workforce Report
- levels.fyi Compensation Data
- DICE Tech Job Report
Browse 52 Infrastructure Jobs → View All Positions
Get Weekly Updates → Subscribe to RSS | View Past Reports
Report generated on June 11, 2026 at 03:00 AM . Data refreshed daily. Market conditions change rapidly - visit parachutes.work for real-time opportunities.